
As important as availability, are the KPIs (Key Performance Indicators) configured in OpMon. By analyzing the evolution of these metrics performance, we can manage the resource capacity, both for exhaustion forecasting, relocating services, as well as generating a better budget of IT resources.
To generate a report for Capacity/Performance, we must:
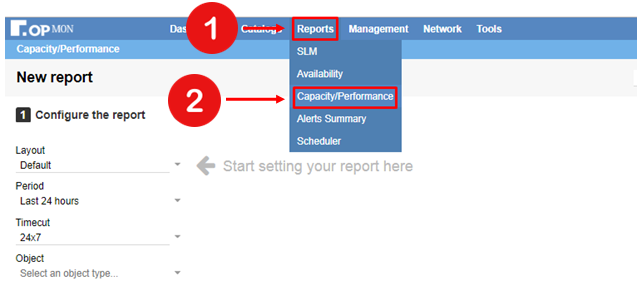
Select the module “Reports” and then the submodule “Capacity/Performance“, according to the image below:
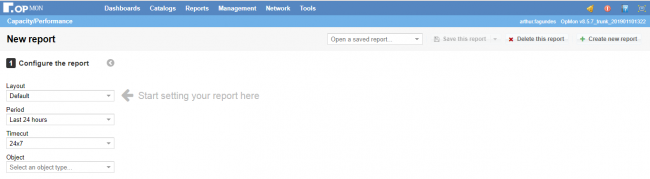
After following the steps described above, you will see a screen that is similar to the one below:
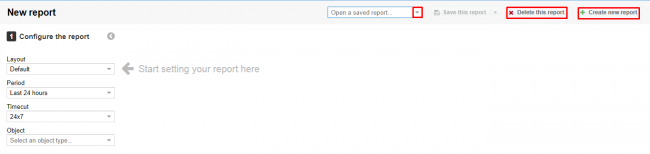
Note that the first field shows the list of saved reports, with the option of saving a new report or even deleting an existing one; check the picture below with the expanded field:
Display types
The first field for creating a new report is “Type“, where there are the options of “Standard“, “Tabular“, “Grouped” and “Customized“:
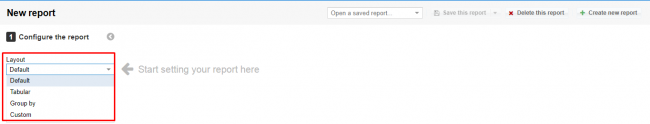
These options differ as follows:
- Default: Presents data collected on a chart where it is possible to analyze the collected indicators; check the example below:
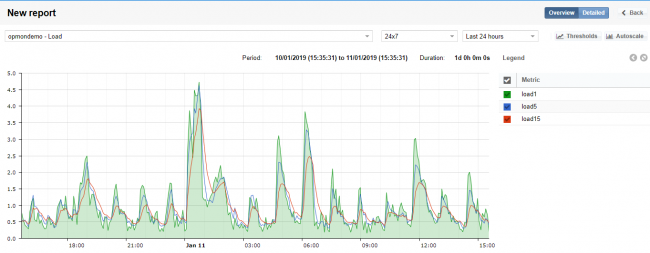
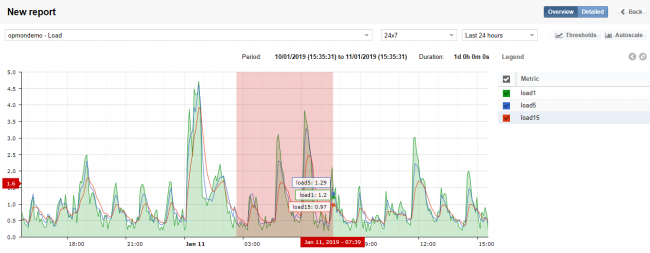
Para os dados de capacidade representados no gráfico, é feita a média dos valores coletados no período selecionado, a fim de que eles possam ser representados via interface. Para obter o dado exato de um determinado período, sem o uso da média, utilize a opção de zoom automático (habilite a lupa – que pode ser visualizada no canto inferior direito da área do gráfico):
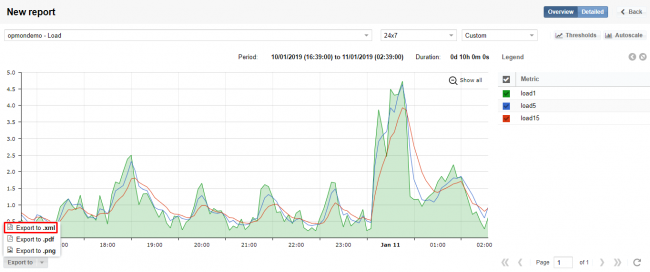
Exporting as XML
Take the time to note that you can export the report to xml format, just use the “Export to” option and then select “Export to .xml“, as shown below:
- Tabular: presents data collected on a table where it is possible to analyze the collected indicators; check an example with the same data from the image above, but in a tabular format:
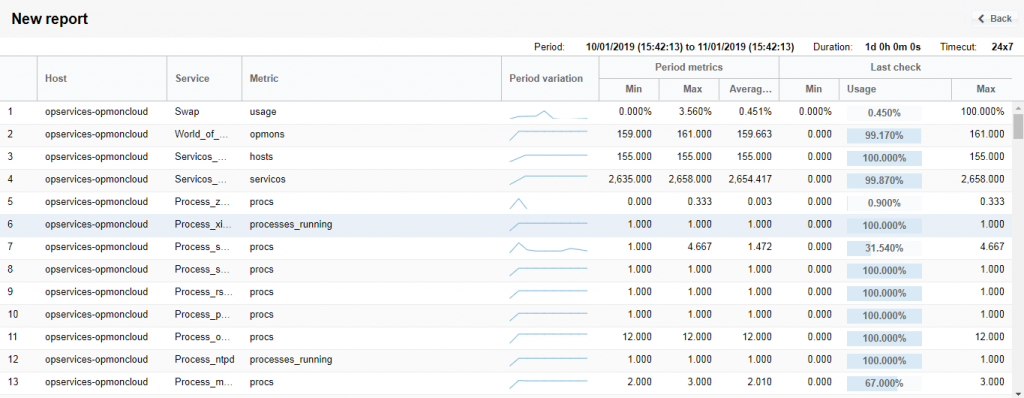
Where:
- Max.: If refers to the maximum metric value in the period;
- Average Grade: If refers to the arithmetic average of the metric values for the period;
- Available: It is he difference between the maximum and the average;
- Usage: If refers to the percentage corresponding to the average used;
- Trends: This is the sparkline type chart showing the values: minimum, maximum, average, last one collected and average value available.
- Customized: from version 5.2 it is possible to customize the Capacity/Performance reports using the Jasper Reports, which is nothing more than a tool for creating custom reports that interact with different types of data.
By means of the data provided by OpMon from an XML file, it is possible to create layouts according to your needs. Watch here the video that shows how to customize the OpMon reports.