
Objective
Use this OpMon Model to monitor Windows Server, through NSClient++.
Target Audience
OpMon admins who wishes to monitor Windows Server.
Prerequisites
- OpMon 7.0 or higher.
- Have the OpMon installed.
- Have the NSClient++ installed, how to make the installation follow this documentation.
Available Services
- Counters:
- PhysicalDisk(_Total)% Disk Time.
- PhysicalDisk(_Total)Current Disk Queue Length.
- PhysicalDisk(_Total)Disk Reads/sec.
- LogicalDisk(_Total)Avg. Disk sec/Read.
- LogicalDisk(_Total)Avg. Disk sec/Write.
- LogicalDisk(_Total)Disk Transfers/sec.
- Memory% Committed Bytes in Use.
- MemoryAvailable MBytes.
- MemoryCache Bytes.
- MemoryFree System Page Table Entries.
- MemoryPage Faults/sec.
- MemoryPage Reads/sec.
- MemoryPages Input/sec.
- MemoryPages/sec.
- MemoryPool Nonpaged Bytes.
- MemoryPool Paged Bytes.
- Paging File(_Total)% Usage.
- PhysicalDisk(_Total)% Idle Time.
- PhysicalDisk(_Total)Avg. Disk Queue Length.
- PhysicalDisk(_Total)Avg. Disk Read Queue Length.
- PhysicalDisk(_Total)Avg. Disk Write Queue Length.
- Process(_Total)IO Data Operations/sec.
- Process(_Total)IO Other Operations/sec.
- Process(_Total)IO Read Operations/sec.
- Process(_Total)IO Write Operations/sec.
- Process(_Total)Page File Bytes.
- Processor(_Total)% DPC Time.
- Processor(_Total)% Idle Time.
- Processor(_Total)% Privileged Time.
- Processor(_Total)% Processor Time.
- Processor(_Total)% User Time.
- Processor(_Total)Interrupts/sec.
- Processor Information(_Total)% C1 Time.
- Processor Information(_Total)% C2 Time.
- Processor Information(_Total)% C3 Time.
- Processor Information(_Total)% Interrupt Time.
- Processor Information(_Total)% of Maximum Frequency
- Processor Information(_Total)% Priority Time
- Processor Information(_Total)% Privileged Time
- Processor Information(_Total)% User Time
- ServerBytes Total/sec
- ServerPool Paged Peak
- ServerWork Item Shortages
- Server Work Queues(0)Queue Length
- Server Work Queues(1)Queue Length
- Server Work Queues(2)Queue Length
- Server Work Queues(3)Queue Length
- System% Registry Quota In Use
- SystemContext Switches/sec
- SystemFile Read Bytes/sec
- SystemFile Write Bytes/sec
- SystemProcessor Queue Length
- SystemThreads
- TCPv4Connections Active
- Thread(dllhost/0)Context Switches/sec
- Thread(dllhost/1)Context Switches/sec
- Thread(dllhost/2)Context Switches/sec
- Thread(dllhost/3)Context Switches/sec
- Ports
- 135
- 139
- 445
- Services
- Dnscache
- eventlog
- gpsvc
- LanmanServer
- LanManWorkstation
- MpsSvc
- MSDTC
- Netlogon
- netprofm
- nlasvc
- RpcEptMapper
- SamSs
Applying the Monitoring Model
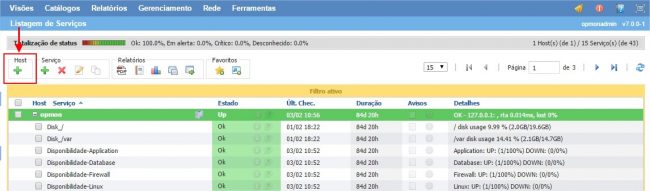
On the hosts or services management area, click on “+” icon to add a new Host, like the image below:
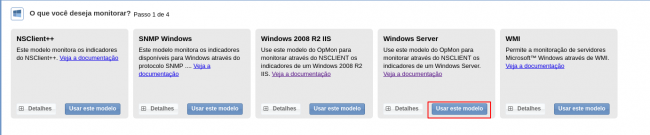
In this area, select the Windows Model Category:

Then click on “Use This Model” on Windows Server:
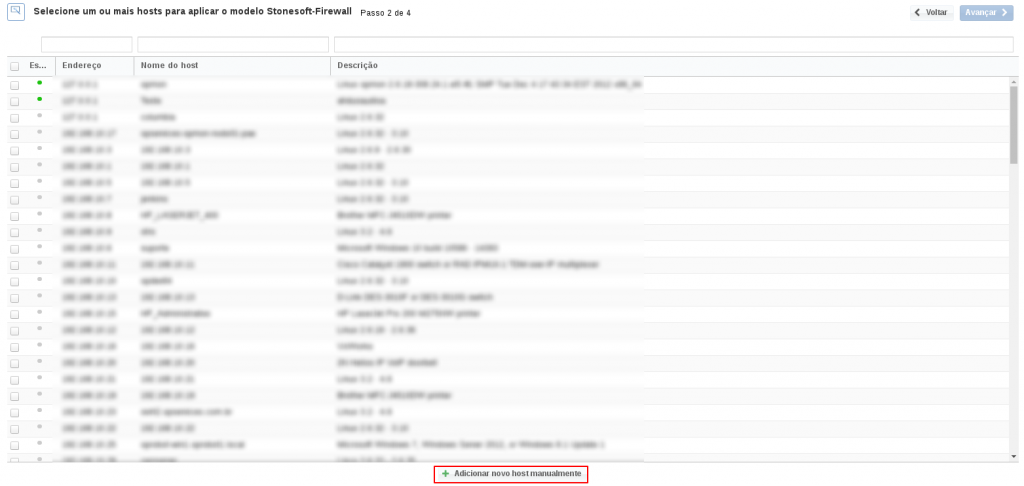
This model could be applied on Windows host, or if you wish, you can add a new host just for this monitor. If you wish add a new host, click on: “Add a new host manually”:
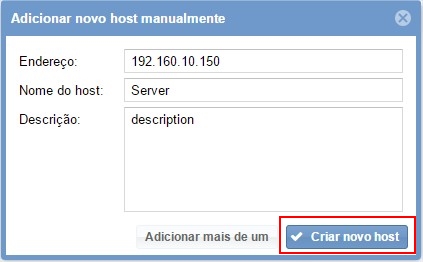
In this area insert the relative information about the Host, in this case the Windows host in question and click in “Create a new host”:
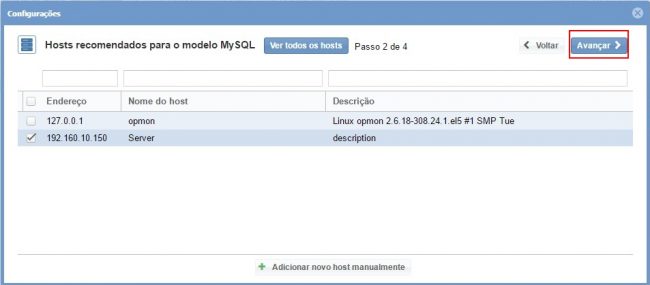
In this area, with the host selected click in “Next”:
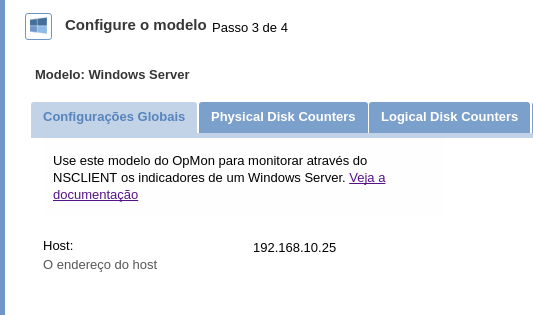
Then you will see an screen like below, where are informed the Windows information like IP.
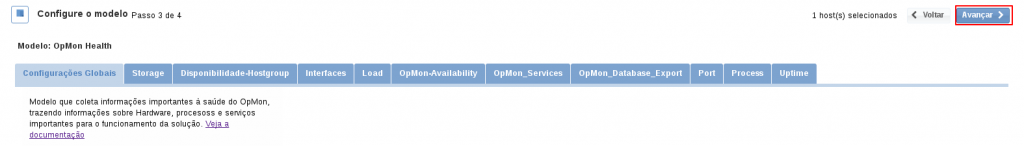
To make the service definitions, just navigate through the services using the buttons “Next” and “Back”:
After concludes the definition of services, advance to the revision area of included services. Enjoy to observes which be possible expand the revision area of hosts and services, just click on “+” icon, like below:
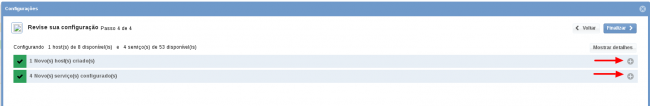
As you can see, in this area it is possible to make changes if necessary. When the definitions are make, just click in “Finalize” to conclude the model application process.
Done! The elements are included with success.