Objective
Describe how to use the XenGuest monitoring model. This model aims to add virtual machines (guests) and their respective counters to monitoring . Click here to monitor Xen Servers.
Target audience
OpMon Administrators and users who need to monitor virtual machines by Xen.
Requirements
- OpMon 7 or higher.
Adding Xen Guests to Monitoring
Select option “Add new host” to get started. This option can be accessed by host or services list. We will be adding a host from the list of services according to the example below:

Click on “Xen” so that you will be able to see a screen similar to the one shown below where you can check all models categories.

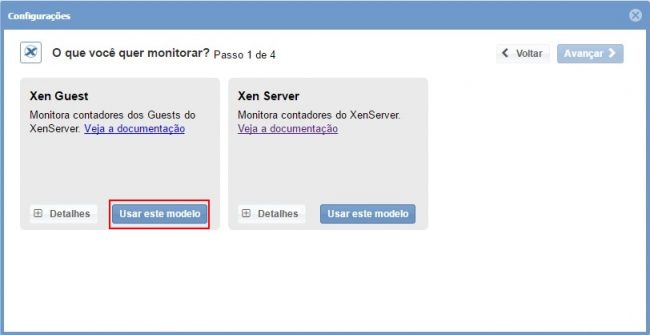
Click on “Use this model” on “Xen Guest” model area according to the image shown below:
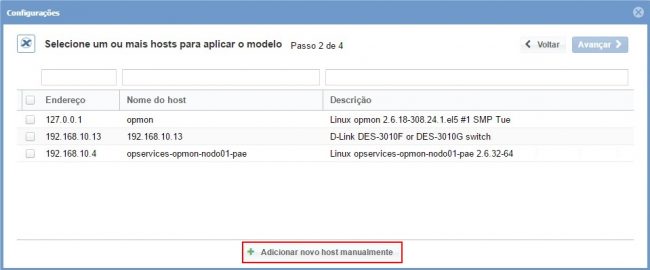
If the equipment that you want to monitor hasn’t been discovered by OpMon yet, you must click on “Add a new host manually” according to the image shown below:
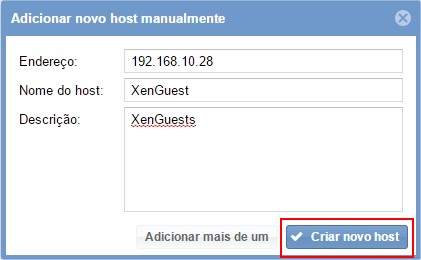
Click on “Create a new host” on this area in order to insert the information related to Server.
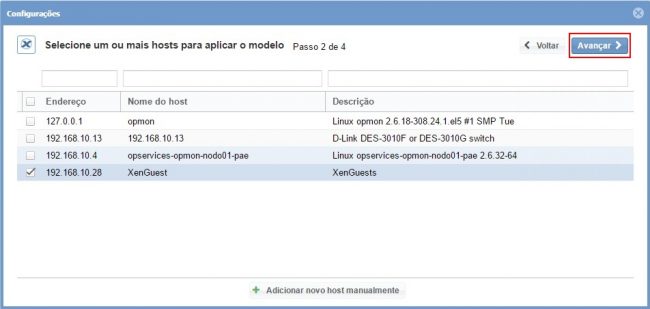
Click on “Next” on this area with the host selected:
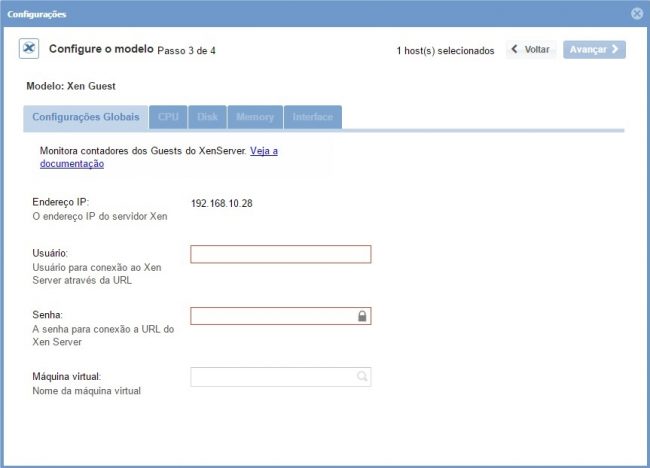
You will see a screen similar to the one shown below where you will must enter user and password from the Serve. These are required fields so that OpMon will be able to identify the virtual machines from this Server.
Note that after entering the server access credentials (user and password) the “Virtual Machine” field will be automatically filled with the list of virtual machines from this server. Click on “Next” in order to select all virtual machines you want to monitor from this list.
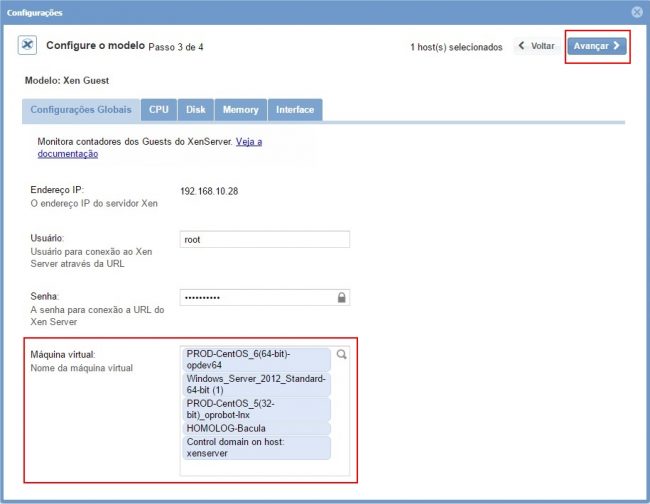
Navigate between the service tabs and select the metrics you want to monitor. To navigate between tabs simply select them directly or use the “Next” button:

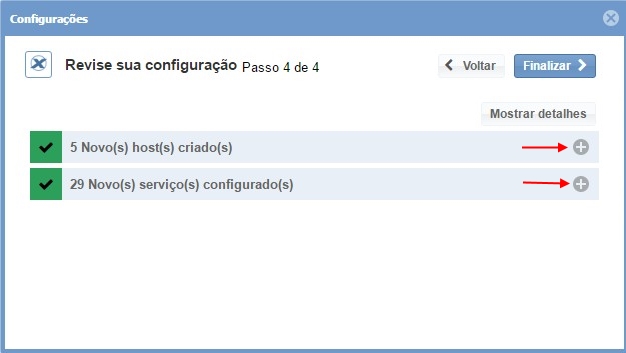
Once the services and their respective metrics that you want to monitor have been completed, simply advance to the review area for the items added. Note that it is possible to expand the summary area of hosts and services by clicking on “+” according to the example shown below:
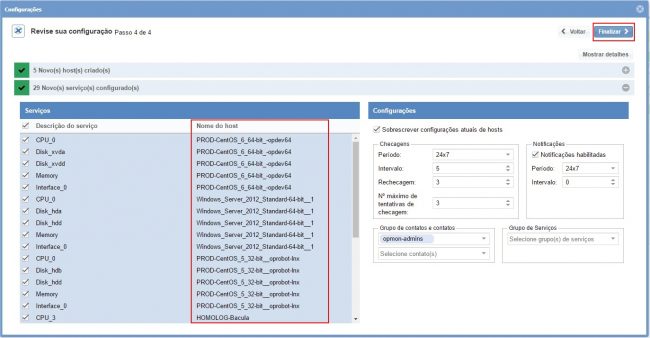
Note that you will be able to make changes if necessary. It’s also possible to see in the “Host Name” area that the hosts to be added to the monitoring will be the selected virtual machines. Each selected Virtual Machine will be a host in OpMon and it will contain all the selected services. Once you have made the settings, click on “Finish” to complete the model application process:
Done! the elements were successfully included in the monitoring.
