
Objective
Show how to use OpMon Traffic Analyzer Model.
Target audience
OpMon Administrator who need to monitoring important data about from OpMon Traffic Analyzer.
Requirements
- OpMon 7.0 or higher;
- You must have OpMon Traffic Analyzer
Available services
- Traffic Probes: Displays how many probes is enable and disabled in OpMon Traffic Analyzer.
- Traffic IP: Displays the amount of traffic collected by the OpMon Traffic Analyzer from a specific IP present on Top IP senders.
- Traffic Unknown Top Ports: Alert if finds in the top ports a port that is not registered on “Application Protocols”.
- Traffic Protocols: Monitors the chosen protocols,allowing that you can generate reports of capacity.
- Traffic Top Protocols: Displays statistics of utilization from protocols present on list of Top Protocols.
- Traffic Detected Ports: Verify if there is traffic on a specific port, throught the aplication protocols.
Applying OpMon Traffic Analyzer Model
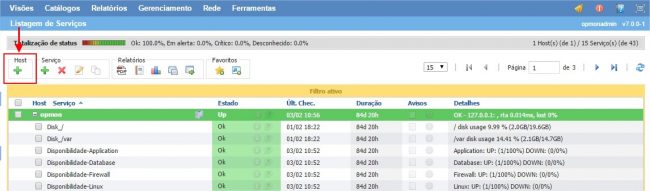
On the managements area of host or services just click on “+” to add a new host, according shown below:
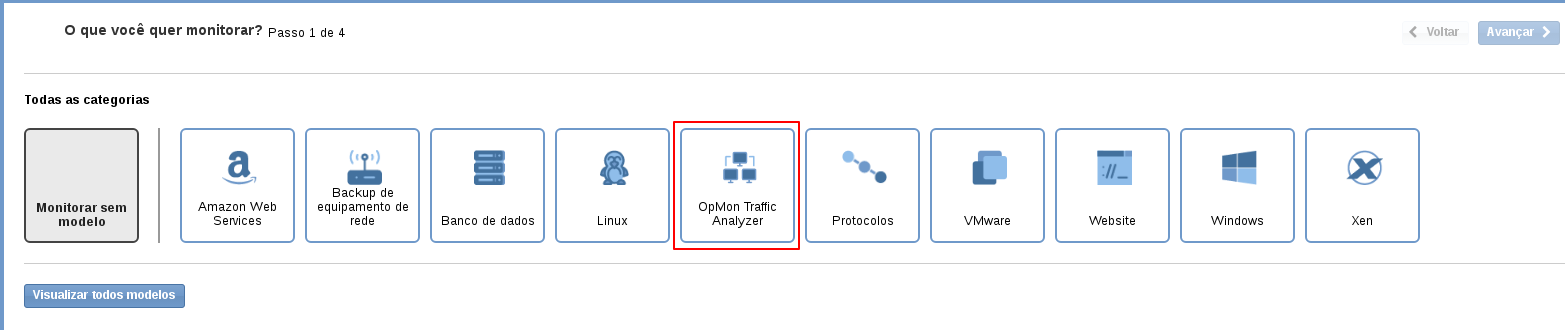
On this area you must click on category “OpMon Traffic Analyzer”:
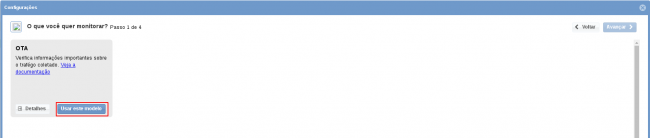
Then, on “OpMon Traffic Analyzer” model area, click on “Use this model”:
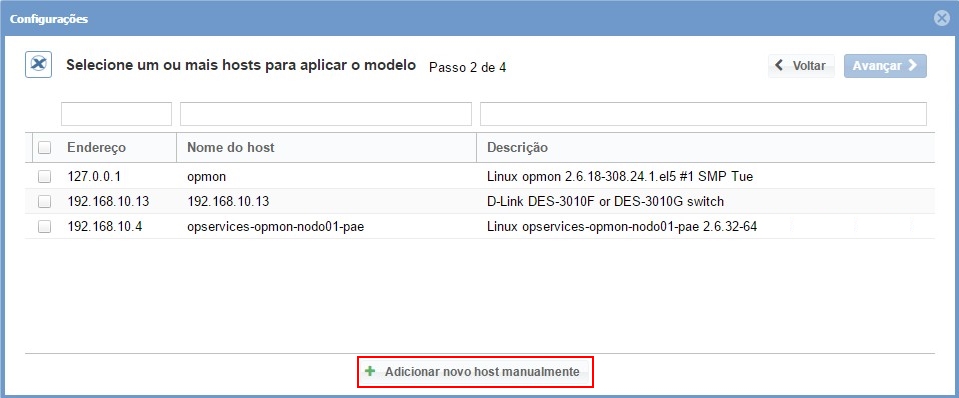
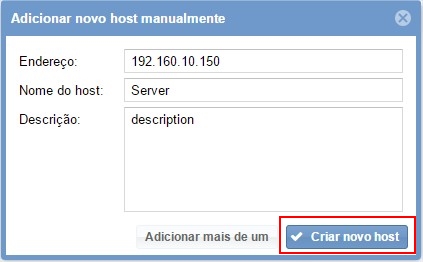
This model can be applyed direct on host OpMon, or if you want, you can add a new host just to apply the services from this model, for this click on ” Add a new host manually” :
On this area insert the relative information to OpMon Traffic Analyzer host, and after click on ” Create a new host”. See the example shown below:
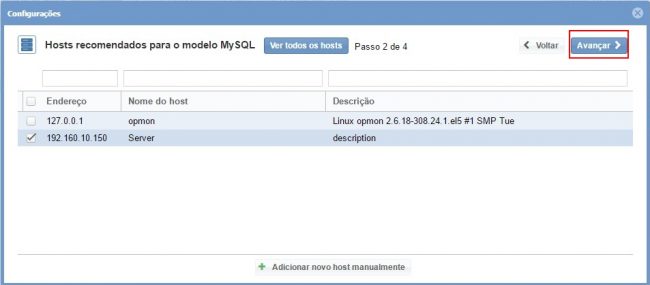
Now, with the host selected click on ” Next”:
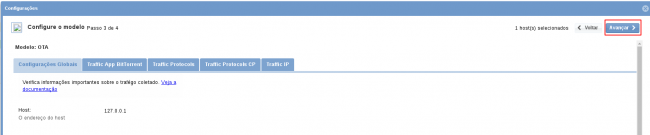
Then, you will see a screen similar to shown below, where is displayed the information about the IP from OpMon Traffic Analizer, just click on ” Next” to start the definition about the services that will be monitored.
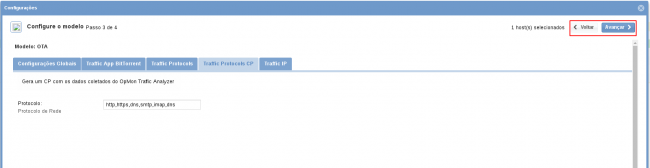
To make the definitions about the services just browse betwen tabs using the buttons “Next” and ” Back”:
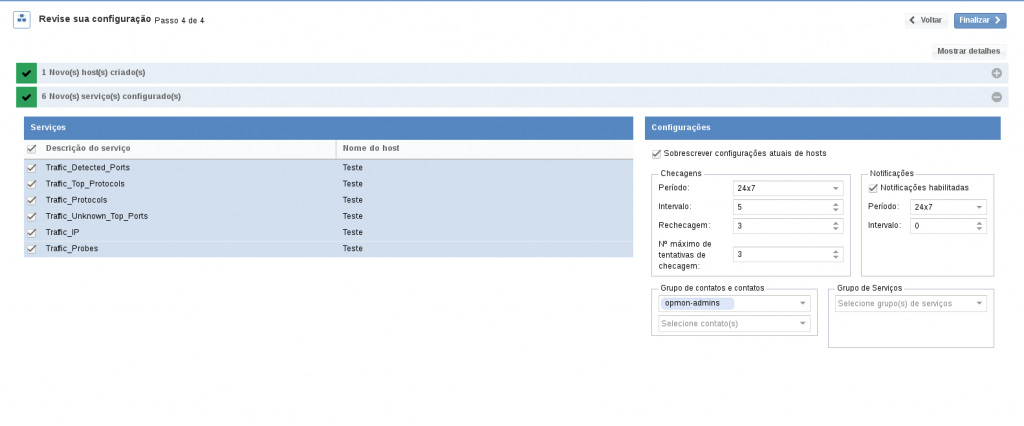
After selecting the services that you want to monitor, proceed to the revision area where the elements are included. It’s also possible to expand the information abou the elements by clicking on “+”, according to image below:
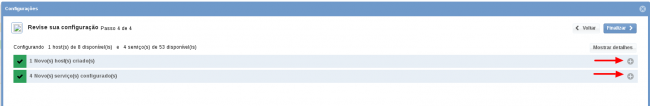
On this area note that is possible make changes if necessary. After concluded all definitions just click on ” Finish” to finish the process of adding elements through OpMon Traffic Analyzer model.
Ready! the elements were successfully included in the monitoring.