
Objective
Describe the available options on Network Outages Management area.
Target audience
Users and Administrators who need to make better use of available resources on Network Outages management area from OpMon Solution.
Requirements
This documentation were based on latest version of OpMon, therefore verify if your OpMon is on the latest version. Click here to know what the version more latest of OpMon.
Overview
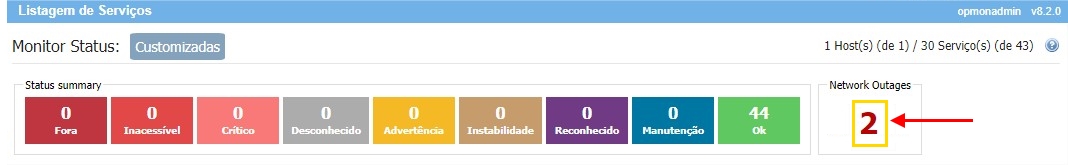
Click on the number relative to total hosts that are affecting other hosts to access Network Outages management area, according to example shown below:
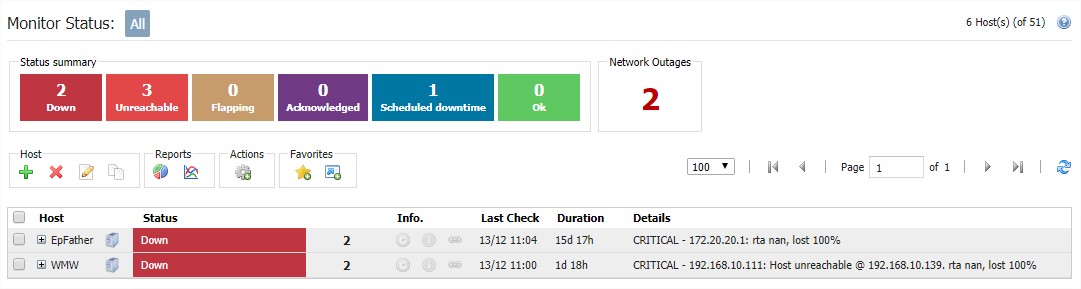
You will see a screen similar shown below:
In this area you can add new elements as well as execute actions necessary to day by day to moniting. In order to make the explanations more didactic, the areas will be divided as the objective of facilitating the functional explanation regarding each one of the sessions.
General information about elements monitored by OpMon
In this area see that is possible quickly visualize the information about to monitoring, where all information are displayed according to context of elements selected.
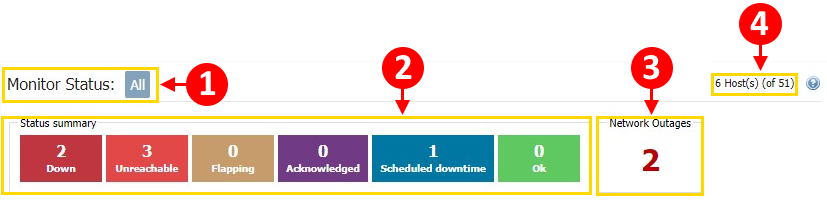
Know more about each one of session.
1: Legend that display the anme of selected filter.
2: In this area it is possible to identify the totalizer relative to each state of the displayed items.
3: In this area, you can see the total network outages, that is, the total hosts that are affecting other hosts.
4: In this area it is possible to identify totalizers about what is being displayed (hosts and services).
Actions, refresh and pagination the elements
The area following displayed is useful to make quick actions on items, as well as set the pagination, refresh and also to select the quantity of items that you want see on the screen:
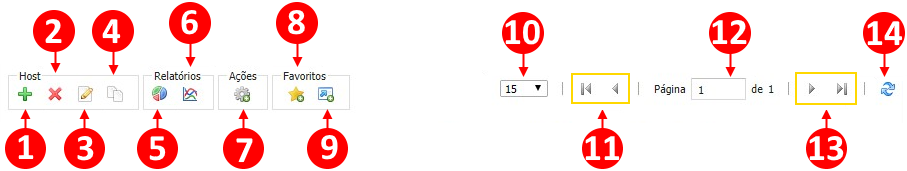
Learn what the expected behavior for each of the items is:
1: Add hosts: Shortcut button to add new hosts , to know more about this function click here.
2: Remove Hosts: Shortcut to remove hosts selected.
3: Edit Hosts: Shortcut button for editing Hosts. To access the corresponding documentation click here.
4: Duplicate Hosts: Shortcut button for Hosts replication. To access the corresponding documentation click here.
5: Availability report: This shortcut generate a availability report from services selected. This option is just a access quick from availability report, to know more about availability report click here.
6: Capacity/Performance report: This shortcut generate a Capacity/Performance report from services selected. This option is just a access quick from Capacity/Performance report, to know more about this report click here.
7: Execute commands: When clicked, a list is displayed with some commands that will be executed on the items that have been selected. These same functionalities can also be viewed from the Host Management area.
8: Favorites: When clicked, it adds the current page to OpMon favorites.
9: Shortcuts: When clicked, it adds the current page to the OpMon shortcuts.
10: Display items: When clicked, the user can determine the number of elements that will be displayed per page.
11: Selectors for navigation between pagination.
12: Page Total: Displays the total of pages generated in the search for an item.
13: Selectors for navigation between pagination.
14: Refresh: When clicked, updates only the window that is being viewed.
Listing of monitored items
In this area are displayed just hosts on down state that have parent/child relationship.
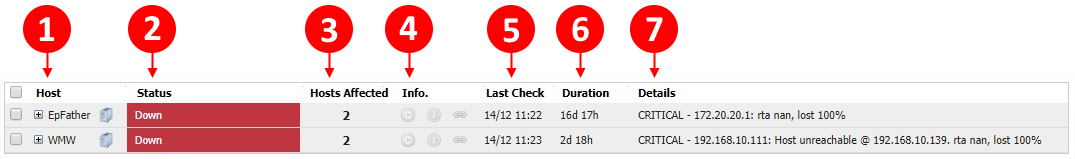
Where:
1: Column that display the name of host;
2: Column that display the state of items monitored;
3: Column that display the total hosts affected by your parent;
4: Column that display extra information about the items monitored;
5: Column that display date and hour of last checking;
6: Column that display the total time that the item be in that state;
7: Column of details that contain data about return of plugin.