Objective
Use this model to monitor OpMon Health.
Target Audience
Administrators which needs monitor the important information about the OpMon, obtained through the OpMon Health.
Pré-requisitos
- OpMon 7.0 or superior;
- Have OpMon installed.
Available Services
- Storage: Show the information about disk usage, physical or virtual memory.
- Disonibilidade Hostgroup: Verifies how many hosts belonging to de host group are UP and how many are DOWN. The available host groups, which are instalation default, are: Application, Database, Firewall, Linux, Networking, NoBreak, OpMon, Printers, Virtualizations e Windows.
- Interfaces: This service provides the information about network interface usage.
- Load: This service provides information about the machine load.
- OpMon Availability: This service shows in percentage the amount of available and unavailable hosts and services.
- OpMon Services: This service bring information about the monitoring, add the following services:
- OpMon Latencia: Show how are the latency, knowing too as check delay to OpMon host and service.
- OpMon Incidentes: Show the amount of how many problems are found on OpMon.
- OpMon Entropy: Show in percentage how many monitor elements have the check and notifications disabled.
- OpMon Errors: Validate the elements configurations, notifying when any configuration have to be corrected.
- OpMon Serviços Monitorados: Show the amount of monitored hosts and services on OpMon.
- OpMon Database Export: This service informs if all tables from database are included on daily backup. It’s important that service have be defined the check period ‘backup’ in this configuration, to define the check period, could be followed that documentation:
- Port: Verifies the response time from a specified port, have the following ports to monitor:
- Port 3306: Port of MySQL.
- Port 443: Port of Apache.
- Port 22: Port of SSH.
- Process: Verifies if the process are running, having the following process to monitor:
- Process Crond: This process is responsible for the task scheduler from Operational System.
- Process Gearmand: OpMon queue manager.
- Process httpd: This process is responsible for the Web access.
- Process mod gearman worker: OpMon check queue.
- Process gearman-utils: Gearman Worker manager.
- Process mysqld safe: This process is responsible for the database (MySQL).
- Process opmon: OpMon process.
- Process opmonconnector: Opmonconnector process.
- Process rsyslogd: Ryslog process.
- Process sshd: SSH process..
- Process snmpd: SNMP process.
- Process Postfix: This process is responsible for the e-mails server.
- MySQL: Monitors the MySQL health, add the following services:
- MySQL Bufferpool hitrate: Provides the information about the buffer pool hitrate.
- MySQL Bufferpool wait free: Provides the information about the buffer pool waits.
- MySQL Connection time: Provides the information about the user connection time.
- MySQL Index usage: Provides the information about the MySQL indexes use.
- MySQL Log waits: Provides the information about the log waits.
- MySQL Long running procs: Provides the information about the active long process on MySQL.
- MySQL Qcache hitrate: Provides the information about the query cache hitrate.
- MySQL Qcache lowmem prunes: Provides the information about the interrupted query cache.
- MySQL Slave lag: Provides the information about the lag (in seconds) of master/slave.
- MySQL Slow queries: Provides the information about the amount of Slow Queries.
- MySQL Table lock contention: Provide the information about the lock contention table.
- MySQL Tablecache hitrate: Provides the information about the cache hitrate table.
- MySQL Threadcache hitrate: Provides the information about the thread-cache currency.
- MySQL Threads connected: Provides the information about the number of active connections.
- MySQL Tmp disk tables: Provides the information about the temporary tables created on disk.
- MySQL Uptime: Provides the information about the time of MySQL server is active.
- Hardware Services: This service monitor basic information about OpMon Hardware. Add the following services:
- CPU Utilization: Informs the CPU utilization.
- IOStat Health: Informs the I/O utilization.
- Mail Queue: Informs the amount of e-mails on postfix queue.
- NTP Time Sync: Verifies the OpMon NTP sync with the NTP server.
- Process Zombie: Verifies if haves zombie process on OpMon.
- Uptime: Informs the machine uptime.
Applying the Monitoring Model
On the hosts or services management area, click on “+” icon to add a new Host, like the image below:

In this area, select the OpMon Model Category:

Then click on “Use This Model” on OpMon Health:

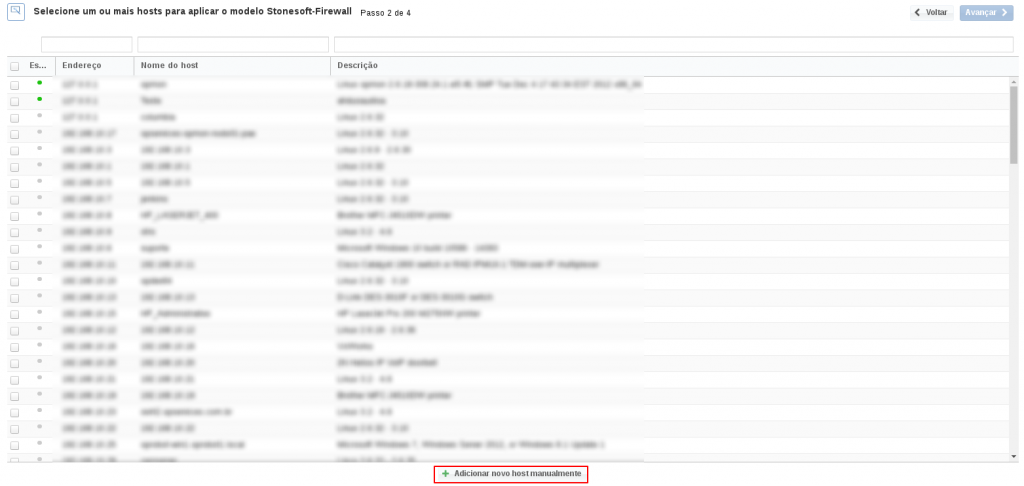
This model could be applied on OpMon host, or if you wish, you can add a new host just for this monitor. If you wish add a new host, click on: “Add a new host manually”:

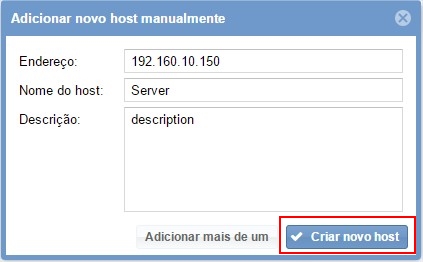
In this area insert the relative information about the Host, in this case the OpMon host in question and click in “Create a new host”:

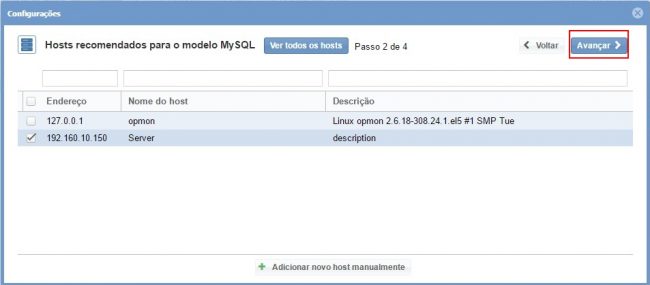
In this area, with the host selected click in “Next”:

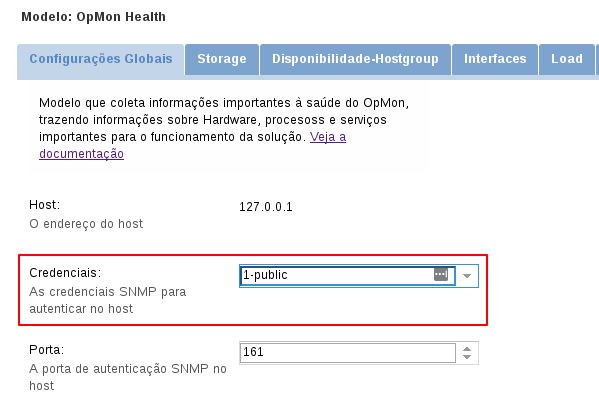
Then you will see an screen like below, where are informed the OpMon information like IP. It is necessary configure the SNMP Credentials, to make that select the respective credential:

To make the service definitions, just navigate through the services using the buttons “Next” and “Back”:

After concludes the definition of services, advance to the revision area of included services. Enjoy to observes which be possible expand the revision area of hosts and services, just click on “+” icon, like below:

As you can see, in this area it is possible to make changes if necessary. When the definitions are make, just click in “Finalize” to conclude the model application process.
Done! The elements are included with success.
