Objective
Describe how to use the model for monitoring MongoDB Server.
Target Audience
Network administrators which needs to monitor MongoDB Server informations.
Requirements
OpMon 8 or higher;
PyMongo library installed in the MongoDB Server;
A user with admin privileges in the MongoDB database;
Allow remote connections to the port 27017.
Available Services
-
- Connect: This service will check each host listed in the MongoDB Servers group.
- Connections: The percentage of free connections left on MongoDB Server.
- Memory Usage: The memory usage of MongoDB Server.
- Mapped Memory: The mapped memory usage of Mongo server.
- Lock Time Percentage: The lock time percentage of Mongo server.
- Average Flush Time: The average flush time of MongoDB Server.
- Last Flush Time: The last flush time of Mongo server.
- Index Miss Ratio: The ratio of index hits missed.
- Databases: Number of databases in the server.
- Queries: The number of queries per second on a server.
Applying MongoDB Monitoring Model
Select option “Add new host” to get started. This option can be accessed by host or services list. We will be adding an additional host from the services list according to the example below.

Click on “Database”:

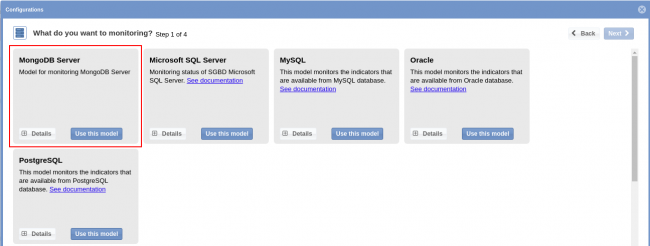
Then, on “MongoDB Server” model area, click on “Use this model”:

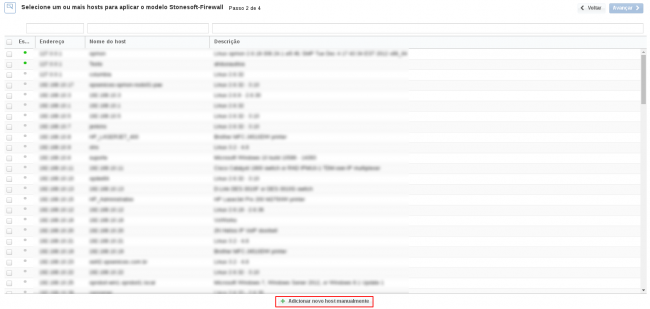
Select the host that you want to monitor. Click on “Add new host manually” if the host hasn’t been discovered by Discovery yet:

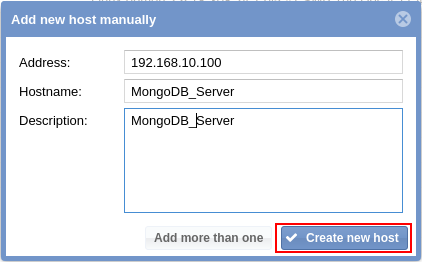
Click on “Create a new host” on this area in order to insert the information related to host:

It’s already possible to notice the host added. Keep the element selected and click on “Next”:

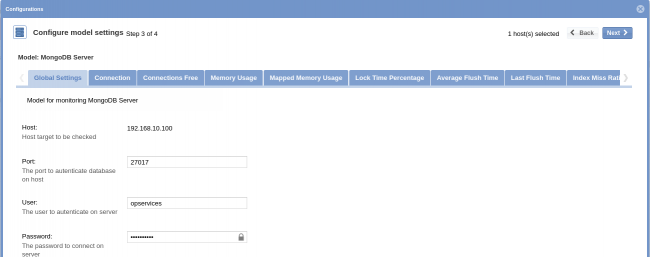
You will see a screen similar to the one shown below where you will must enter an access to MongoDB Server.

Check the all services and click on “Finish”:

