Objective
Describe the steps necessary to configure OpMon Traffic Analyzer.
Target audience
Intended to administrators and IT teams that need configure OpMon Traffic Analyzer.
Configuring OpMon Traffic Analyzer
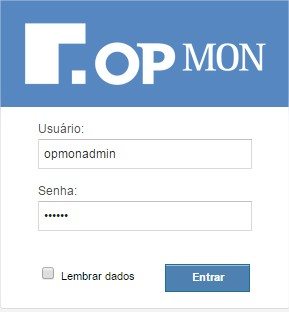
Access OpMon through web interface:
You will see a screen similar to this shown below, where you will must pointing your mouse on the “Network” and then click on “Traffic Analyzer“:

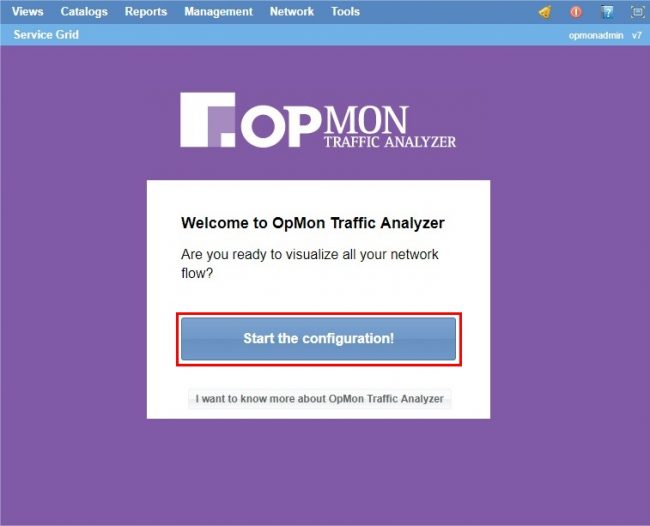
The first screen that you see, is a screen similar to shown below, here you will must click on “Start the Configuration” to start configuration process:
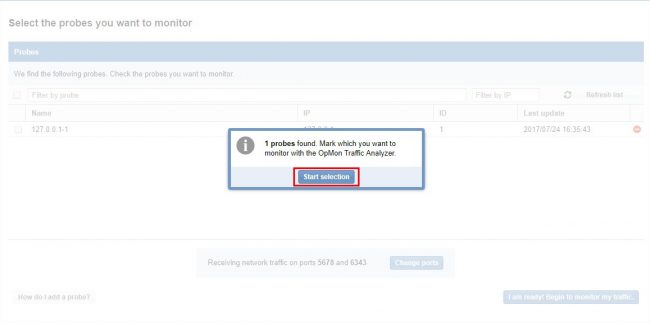
All collectors identified by OpMon Traffic Analyzer is shown through interface, in example below was identified 1 Probe, see that OpMon Traffic Analyzer display a message informing the amount Probes found, to continue click on “Start selection“:
How to change IP and/or port
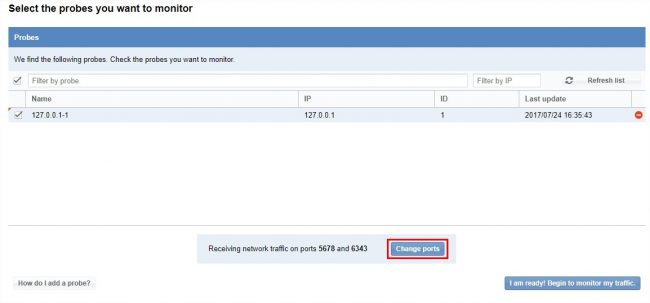
You can change the receiving port of network traffic, just click on “Change ports” option, see below:
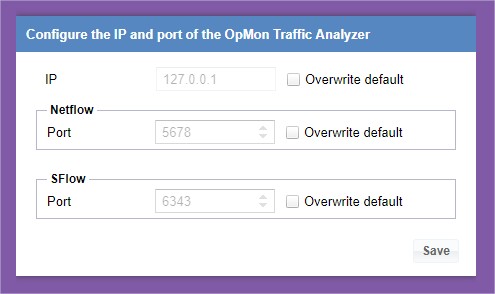
You will see a screen similar to shown below, where you will can overwrite the IP, and NetFlow and SFlow ports. After to do this, just click on “Save” and after on “Back” to retun to Discovered Porbes area.
It’s important to know that the option “Sobrescrite IP” it useful only when the configuration have the OpMon and Traffic Analyzer, because both of them are running in different infrastructure, like this the IP to be insert on OpMon have to be the OTA IP which is receiving the flows. This way you access the OTA through OpMon. Case the OTA and OpMon are only one infrastructure, this configuration don’t need to be altered.
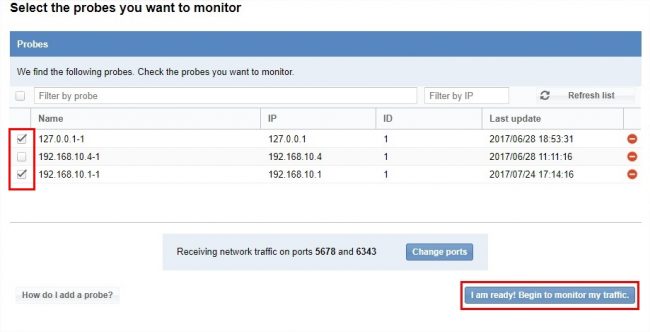
Select the traffic`s fonts that you want monitoring and after click on “I am ready! Begin to monitor my traffic“:
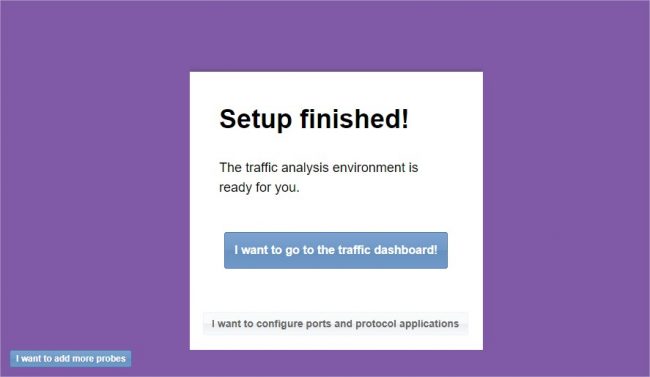
In the next screen you will see a screen similar to this, informing that Configuration was concluded, where you can also go to view of Dashboards, as well as configure ports and protocol applications:
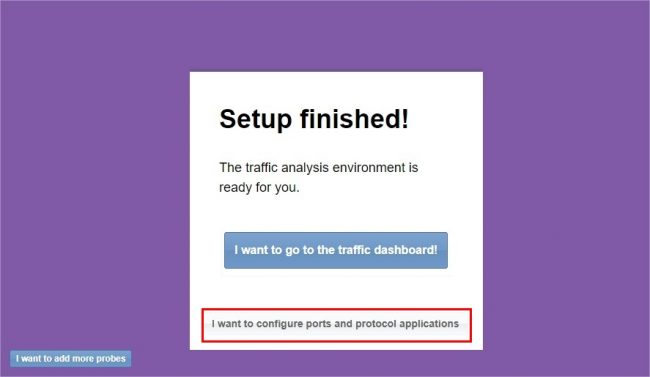
I want to configure ports and protocol applications
To configure ports and protocol applications, just click on “I want to go to the traffic dashboard” option, according shown below:
To add a new protocol just click on “Add new Application Protocol“:
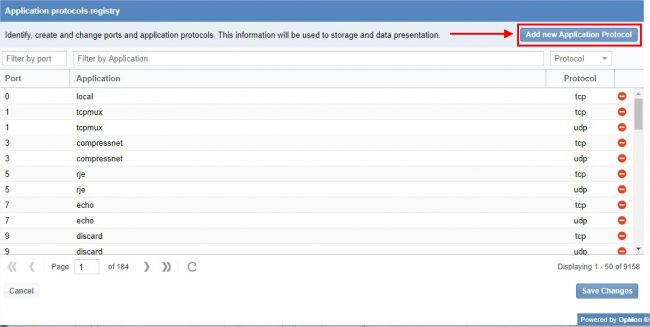
Input the port, application name and protocol, after, just click on “Update“:

After included the new protocol, just click on “Save changes”:
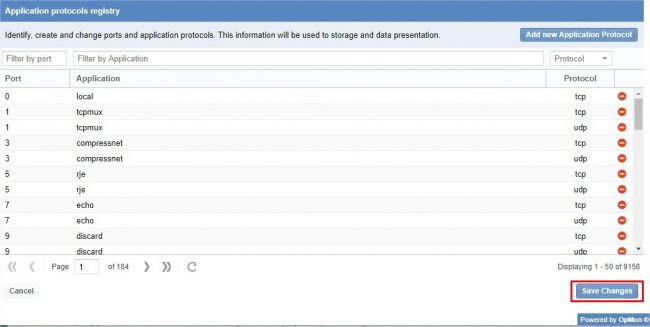
You will see a message similar to this shown below, confirming the configuration made.

I want to go to the traffic dashboard
To go to the traffic dashboard, just click on “I want to go to the traffic dashboard”, according screen below:

Selecting this option you will be redirect to dashboard area, where you will see a screen similar shown below, in this area are display the on real time data about your network:
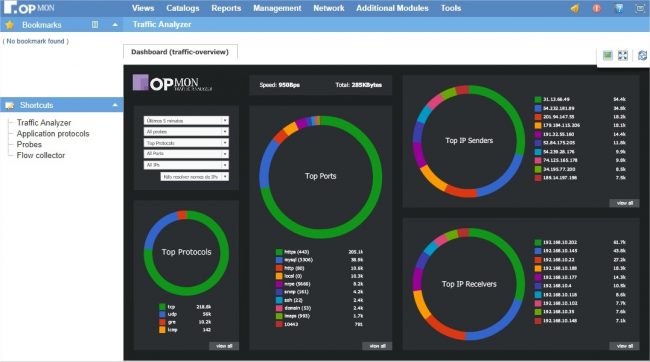
On this screen you can see the following informations: Top Protocols, Top Ports, Top IP Senders and Top IP Receivers. Note to see that is possible pointing your mouse coursor about the dashboard area that you want obteing more datails. See the example below:
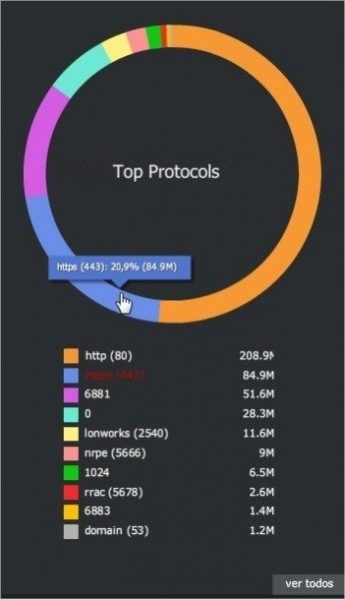
With regard to the graph displayed above, is important highlight that in this area is displayed just top 10 events in percent, but you have the option to view all, just click on “View all“.
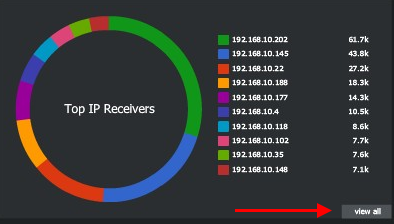
Although the dashboards by default is plotted with data in real time, is possible that you obtaining past data, using for this the filter that located on the left of screen, according screen shown below:
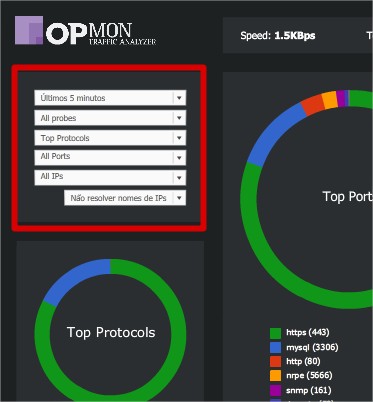
Is possible click on the elements to obtain more information about them, observe that filter is context-sensitive, that is, when you click on a specific chart element , the filter will be sensitized the selected data.
Integrating with OpMon
After realize OTA’s setup, is possible view the collected data through OTA of production, uniting all informations.
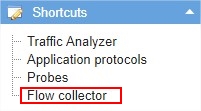
For this, access OTA and click on “Flow collector“, according shown below:
You will see a screen similar to shown below, where you must set OpMon’s IP that you want monitor. For this, select “Overwrite” option and insert the IP. Done that, just click on “save”.
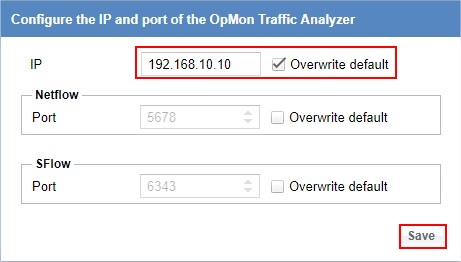
Concluded this procedure, just access OTA throuth OpMon to validate its operation. Remember that in OpMon it will also be necessary to have the Traffic Analyzer module enabled through the license.

