Objective
Use this OpMon model to monitor through JMX the indicators of Java-based web applications such as TomCat, Weblogic, WebSphere. It is compatible with JMX version 7 or lower.
Target Audience
Administrators which needs monitor important information about web applications using the Monitoring Model.
Prerequisites
- OpMon 7.0 or superior.
- Have the OpMon instaled.
- Have followed the following instructions described on this link.
Available Services
- Threading: Monitors the amount of active Threads, CPU Time, User Time, Inicialization Time and JVM peaks.
- Runtime: Monitors the Java Runtime Environment (JRE) indicators, like the Class Path, Vendor Name, Spec Name e Vendor e Uptime.
- OperatingSystem: Monitors the important indicators to JMX operations, like Physical and Virtual Memory usage, Queues, Uptime, CPU and Architecture.
- MBeanServerDelegate: Monitors the information about MBeanServer, like ID, name and version.
- BufferPoolDirect: Monitors the amount of memory usage from Java interface.
- BufferPoolMapped: Monitors the amount of memory usage from Java instances create.
- ClassLoading: Monitors how many classes JAVA are loaded and not loaded.
- GarbageCollector: Monitors the amount and the time of Old and Young Generations objects not used from Java Application.
- MemoryPool: Monitors the Memory Pool used by Old and Perm Generation applications.
- ThreadPool: Monitors the Threads Pools of environment, being possible monitors the amount of Requests, Queue and Capacity.
- MemoryHeap: Monitors the amount of heap memory used by JMX environment.
Appling the JMX Monitoring Model
On the hosts or services management area, click on “+” icon to add a new Host, like the image below:

In this area, select the Web Applications Category:

Then click on “Use this Model” on JMX Model:
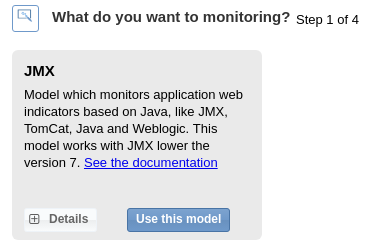
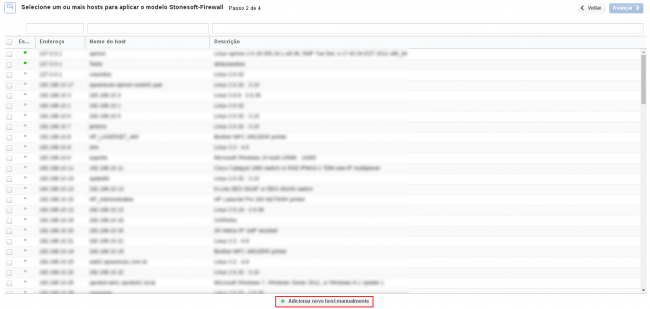
This model could be applied on any host, because the host to be monitoring is passed from parameter. If you wish add a new host, click on “Add a new host manually”:
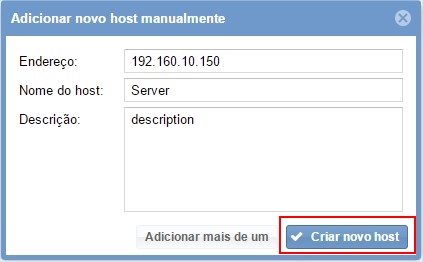
In this area insert the relative informations about the Host and click in “Create a new host”
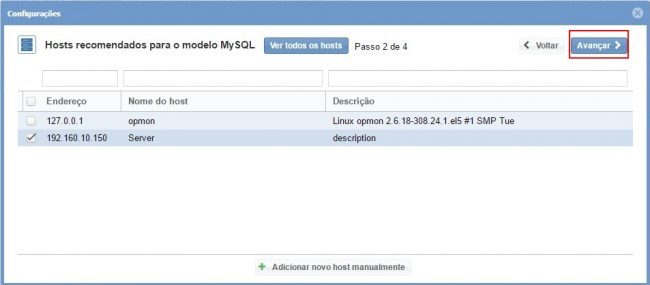
In this area, with the host selected click in “Next”:
Then you will see an screen like bellow, where it is needed specify the host IP. And will be necessary configure the port allowed to connect, see:

After concludes the definition of services, advance to the revision area of included services. Enjoy to observes which be possible expand the revision area of hosts and services, just click on “+” icon, like below:

As you can see, in this area it is possible to make changes if necessary. When the definitions are make, just click in “Finalize” to conclude the model application process.
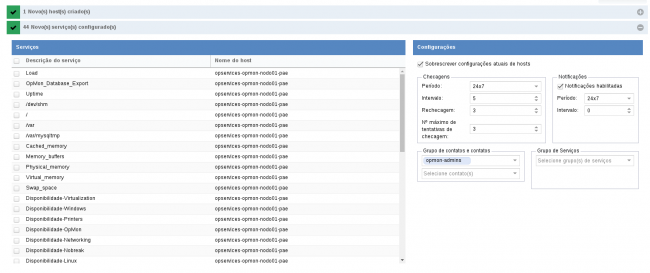
Done! The elements are included with success
