Objective
Use this model to monitor OpMon Health Cluster.
Target Audience
Administrators which needs monitor the important information about the OpMon, obtained through the OpMon Health Cluster.
Prerequisites
- OpMon 7.0 or superior;
- Have the OpMon installed in cluster mode.
Available Services
- German_Queues: Show information about the Gearmand Queues. Add the following services:
- Gearman Orphaned Jobs: Informa se há alguma fila órfã no Gearmand.
- Gearman Queue Host: Informs the amount of jobs to be consumed on the Gearmand Host Queue.
- Gearman Queue Opdb Opstatus: Informs the amount of jobs to be consumed on the Gearmand Opstatus Queue, responsible from the service states.
- Gearman Queue Opdb Perfdata: Informs the amount of jobs to be consumed on the Gearmand Perfdata Queue, responsible from the perf data.
- Gearman Queue Opdb Ptables: Informs the amount of jobs to be consumed on the Gearmand Ptable Queue, responsible form the export configurations applied.
- Gearman Queue Service: Informs the amount of jobs to be consumed on the Gearmand Service Queue.
- OpMon Services: This services brings informations about the monitoring, add the following services:
- OpMon Latencia: Show how are the latency, knowing too as check delay to OpMon host and service.
- OpMon Incidentes: Show the amount of how many problems are found on OpMon.
- OpMon Entropy: Show in percentage how many monitor elements have the check and notifications disabled.
- OpMon Errors: Validate the elements configurations, notifying when any configuration have to be corrected.
- OpMon Serviços Monitorados: Show the amount of monitored hosts and services on OpMon.
- OpMon Available Hosts: Show the amount of OpMon Host are available and unavailable.
- OpMon Available Services: Show the amount of OpMon Services are available and unavailable.
- OpMon Cluster: Informs if the cluster are OK.
- OpMon Log Status: Informs if the logs are being rotated.
- Process Syncfiles: This service verifies if the Syncfiles Process are running in one node cluster only.
- Process OpMon: This service verifies if the OpMon Process are running in one node cluster only.
Applying the Monitoring Model
On the hosts or services management area, click on “+” icon to add a new Host, like the image below:

In this area, select the OpMon Model Category:

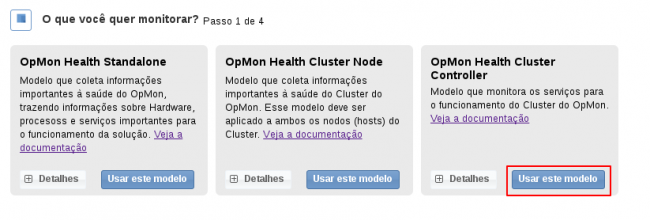
Then click on “Use This Model” on OpMon Health Cluster:
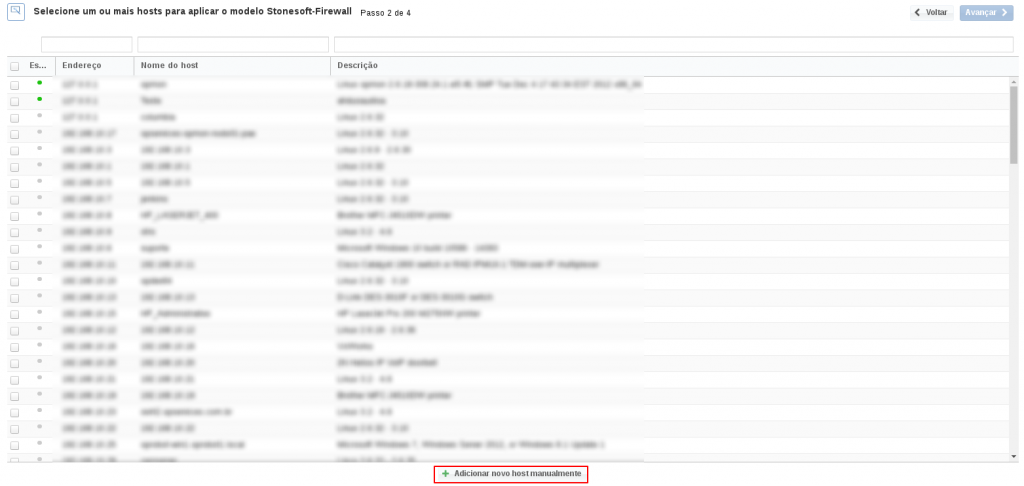
This model could be applied on OpMon host, or if you wish, you can add a new host just for this monitor. If you wish add a new host, click on: “Add a new host manually”:
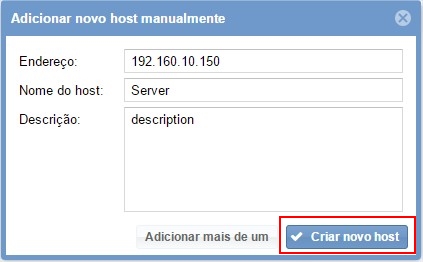
In this area insert the relative information about the Host, in this case the OpMon host in question and click in “Create a new host”:
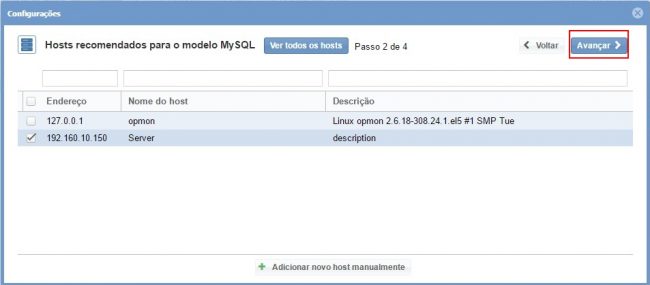
In this area, with the host selected click in “Next”:
Then you will see an screen like below, where are informed the OpMon information like IP. It is necessary configure the Job Server IP:
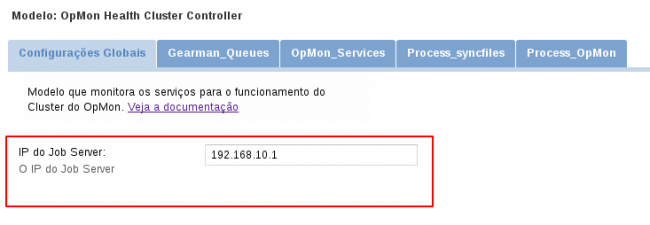
To make the service definitions, just navigate through the services using the buttons “Next” and “Back”:

After concludes the definition of services, advance to the revision area of included services. Enjoy to observes which be possible expand the revision area of hosts and services, just click on “+” icon, like below:

As you can see, in this area it is possible to make changes if necessary. When the definitions are make, just click in “Finalize” to conclude the model application process.
Done! The elements are included with success.
