
Objective
Show how to use Amazon Elastic Computer Cloud (Amazon EC2) monitoring model, as well as, describe the metrics available on this model.
Target audience
OpMon administrators who need to monitor instances of Amazon EC2.
Requirements
- OpMon 7 or higher;
- You must have the access data to the instance that you want to monitor.
Solution
Amazon sends metrics to Cloud Watch from yours EC2 instance, by default, Amazon EC2 sends metrics using intervals of 5 minutes between them.
You can enable the detailed monitoring from your instance in order to send metrics data from your instance to Cloud Watch using shorter intervals of 1 minute. For further information, click here to enable or disabled the detailed monitoring from your instances.
Applying Amazon EC2 Model
Select option “Add new host” to get started. This option can be accessed by the host or services list. We wil be adding an additional host from the services list according to the example below.

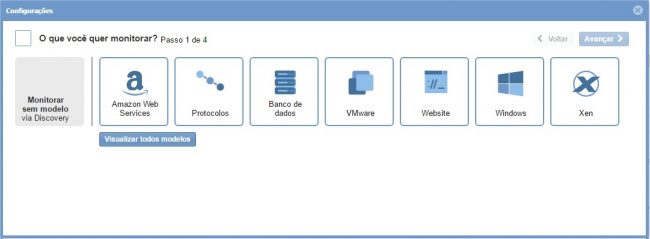
You will be able to see a screen similar to the one shown below where you can see all models categories, click on “Amazon Web Services”.
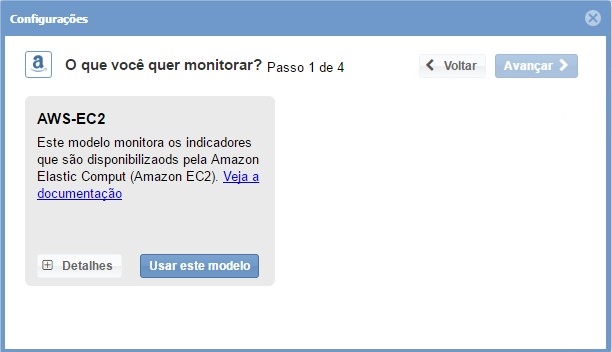
Then, on “AWS-EC2” model area, click on “Use this model”:
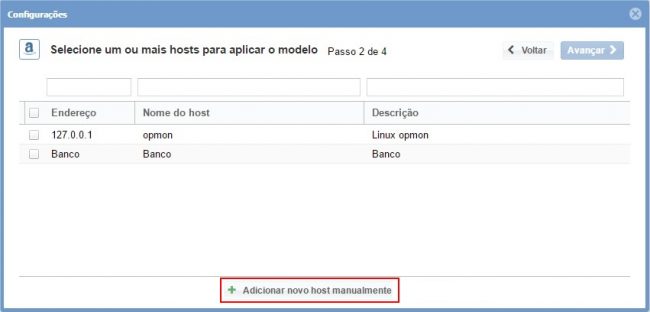
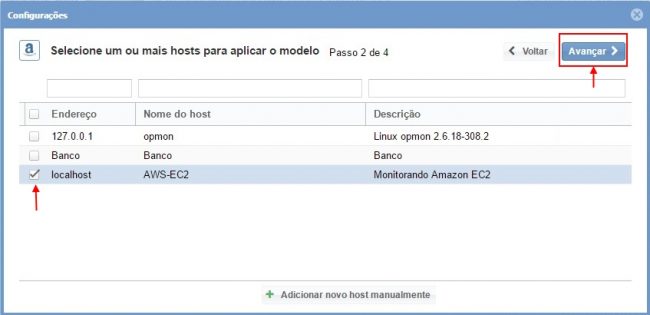
On the next screen you will see a screen similar to the one below where you will be able to visualize the discovered hosts. Select the option “Add a new host manually” on this screen.
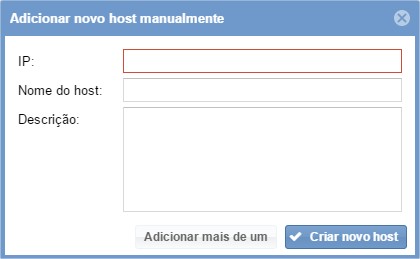
Then, enter the element identification data, in the IP field enter “localhost” and after that enter the name and description about monitoring.
It’s already possible to visualize the host added, keep the element selected and click on “Next”.
Now, you must insert the model’s global params, it is the parameters that will be used to collect all the metrics.
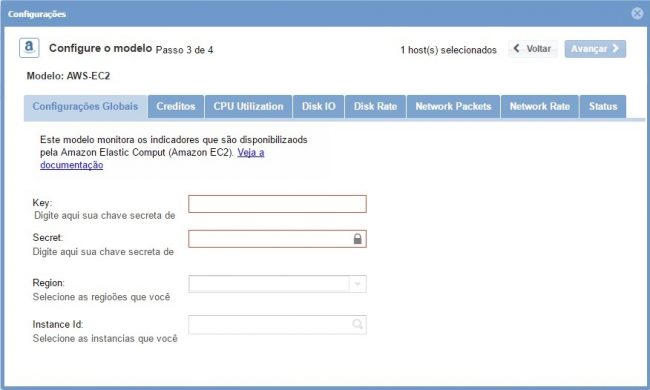
To run the model effectively it’s necessari to insert your Key and Secret. It will discover automatically all regions according to the Key and Secret provided. Note that the list containg all instances is only available for selection after the regions are selected.
After providing the global data, the tabs are automatically enabled to select metrics. Select the metric you want to monitor.
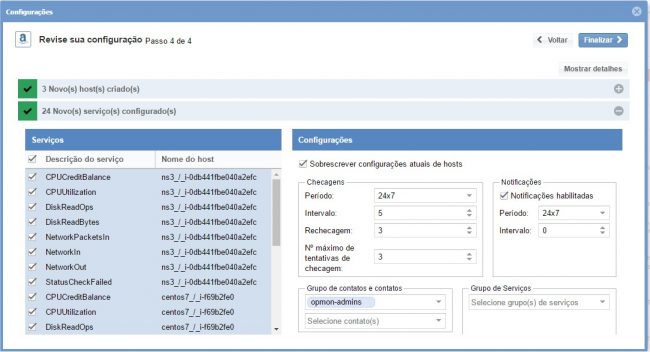
After selecting the metrics that you want to monitor, proceed to the revision area where the elements are included. It’s also possible to expand the information abou the elements by clicking on “+”, according to image below:

It’s possible to make changes if necessary:
Made the definitions, just click on “Finish” to finish the process of adding elements through Amazon EC2 model.
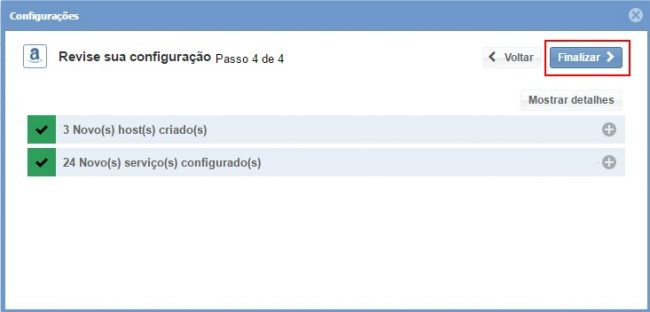 Ready! the elements were successfully included in the monitoring. Then learn more about each of the metrics available in Amazon EC2 Model monitoring.
Metrics
The following metrics are monitored by Amazon EC2 model
CPU Credit
The AWS/EC2 namespace includes the following CPU credit metrics for your T2 instances.
| Metric | Description |
|---|---|
| CPUCreditUsage |
[T2 instances] The number of CPU credits consumed by the instance. One CPU credit equals one vCPU running at 100% utilization for one minute or an equivalent combination of vCPUs, utilization, and time (for example, one vCPU running at 50% utilization for two minutes or two vCPUs running at 25% utilization for two minutes). CPU credit metrics are available only at a 5 minute frequency. If you specify a period greater than five minutes, use the Units: Count |
| CPUCreditBalance |
[T2 instances] The number of CPU credits available for the instance to burst beyond its base CPU utilization. Credits are stored in the credit balance after they are earned and removed from the credit balance after they expire. Credits expire 24 hours after they are earned. CPU credit metrics are available only at a 5 minute frequency. Units: Count |
Instance
The AWS/EC2 namespace includes the following instance metrics.
| Metric | Description |
|---|---|
| CPUUtilization |
The percentage of allocated EC2 compute units that are currently in use on the instance. This metric identifies the processing power required to run an application upon a selected instance. To use the percentiles statistic, you must enable detailed monitoring. Depending on the instance type, tools in your operating system can show a lower percentage than CloudWatch when the instance is not allocated a full processor core. Units: Percent |
| DiskReadOps |
Completed read operations from all instance store volumes available to the instance in a specified period of time. To calculate the average I/O operations per second (IOPS) for the period, divide the total operations in the period by the number of seconds in that period. Units: Count |
| DiskWriteOps |
Completed write operations to all instance store volumes available to the instance in a specified period of time. To calculate the average I/O operations per second (IOPS) for the period, divide the total operations in the period by the number of seconds in that period. Units: Count |
| DiskReadBytes |
Bytes read from all instance store volumes available to the instance. This metric is used to determine the volume of the data the application reads from the hard disk of the instance. This can be used to determine the speed of the application. The number reported is the number of bytes received during the period. If you are using basic (five-minute) monitoring, you can divide this number by 300 to find Bytes/second. If you have detailed (one-minute) monitoring, divide it by 60. Units: Bytes |
| DiskWriteBytes |
Bytes written to all instance store volumes available to the instance. This metric is used to determine the volume of the data the application writes onto the hard disk of the instance. This can be used to determine the speed of the application. The number reported is the number of bytes received during the period. If you are using basic (five-minute) monitoring, you can divide this number by 300 to find Bytes/second. If you have detailed (one-minute) monitoring, divide it by 60. Units: Bytes |
| NetworkIn |
The number of bytes received on all network interfaces by the instance. This metric identifies the volume of incoming network traffic to a single instance. The number reported is the number of bytes received during the period. If you are using basic (five-minute) monitoring, you can divide this number by 300 to find Bytes/second. If you have detailed (one-minute) monitoring, divide it by 60. Units: Bytes |
| NetworkOut |
The number of bytes sent out on all network interfaces by the instance. This metric identifies the volume of outgoing network traffic from a single instance. The number reported is the number of bytes received during the period. If you are using basic (five-minute) monitoring, you can divide this number by 300 to find Bytes/second. If you have detailed (one-minute) monitoring, divide it by 60. Units: Bytes |
| NetworkPacketsIn |
The number of packets received on all network interfaces by the instance. This metric identifies the volume of incoming traffic in terms of the number of packets on a single instance. This metric is available for basic monitoring only. Units: Count Statistics: Minimum, Maximum, Average |
| NetworkPacketsOut |
The number of packets sent out on all network interfaces by the instance. This metric identifies the volume of outgoing traffic in terms of the number of packets on a single instance. This metric is available for basic monitoring only. Units: Count Statistics: Minimum, Maximum, Average |
Status
The AWS/EC2 namespace includes the following status checks metrics. Status check metrics are available at a 1 minute frequency. For a newly-launched instance, status check metric data is only available after the instance has completed the initialization state (within a few minutes of the instance entering the running state).
| Metric | Description |
|---|---|
| StatusCheckFailed |
Reports whether the instance has passed both the instance status check and the system status check in the last minute. This metric can be either 0 (passed) or 1 (failed). Units: Count |
| StatusCheckFailed_Instance |
Reports whether the instance has passed the instance status check in the last minute. This metric can be either 0 (passed) or 1 (failed). Units: Count |
| StatusCheckFailed_System |
Reports whether the instance has passed the system status check in the last minute. This metric can be either 0 (passed) or 1 (failed). Units: Count |